Adding Insights
On this page
Adding Insights
Create and customize visual insights using graph types and advanced settings to analyze data effectively.
- From the Action Menu, select Edit.
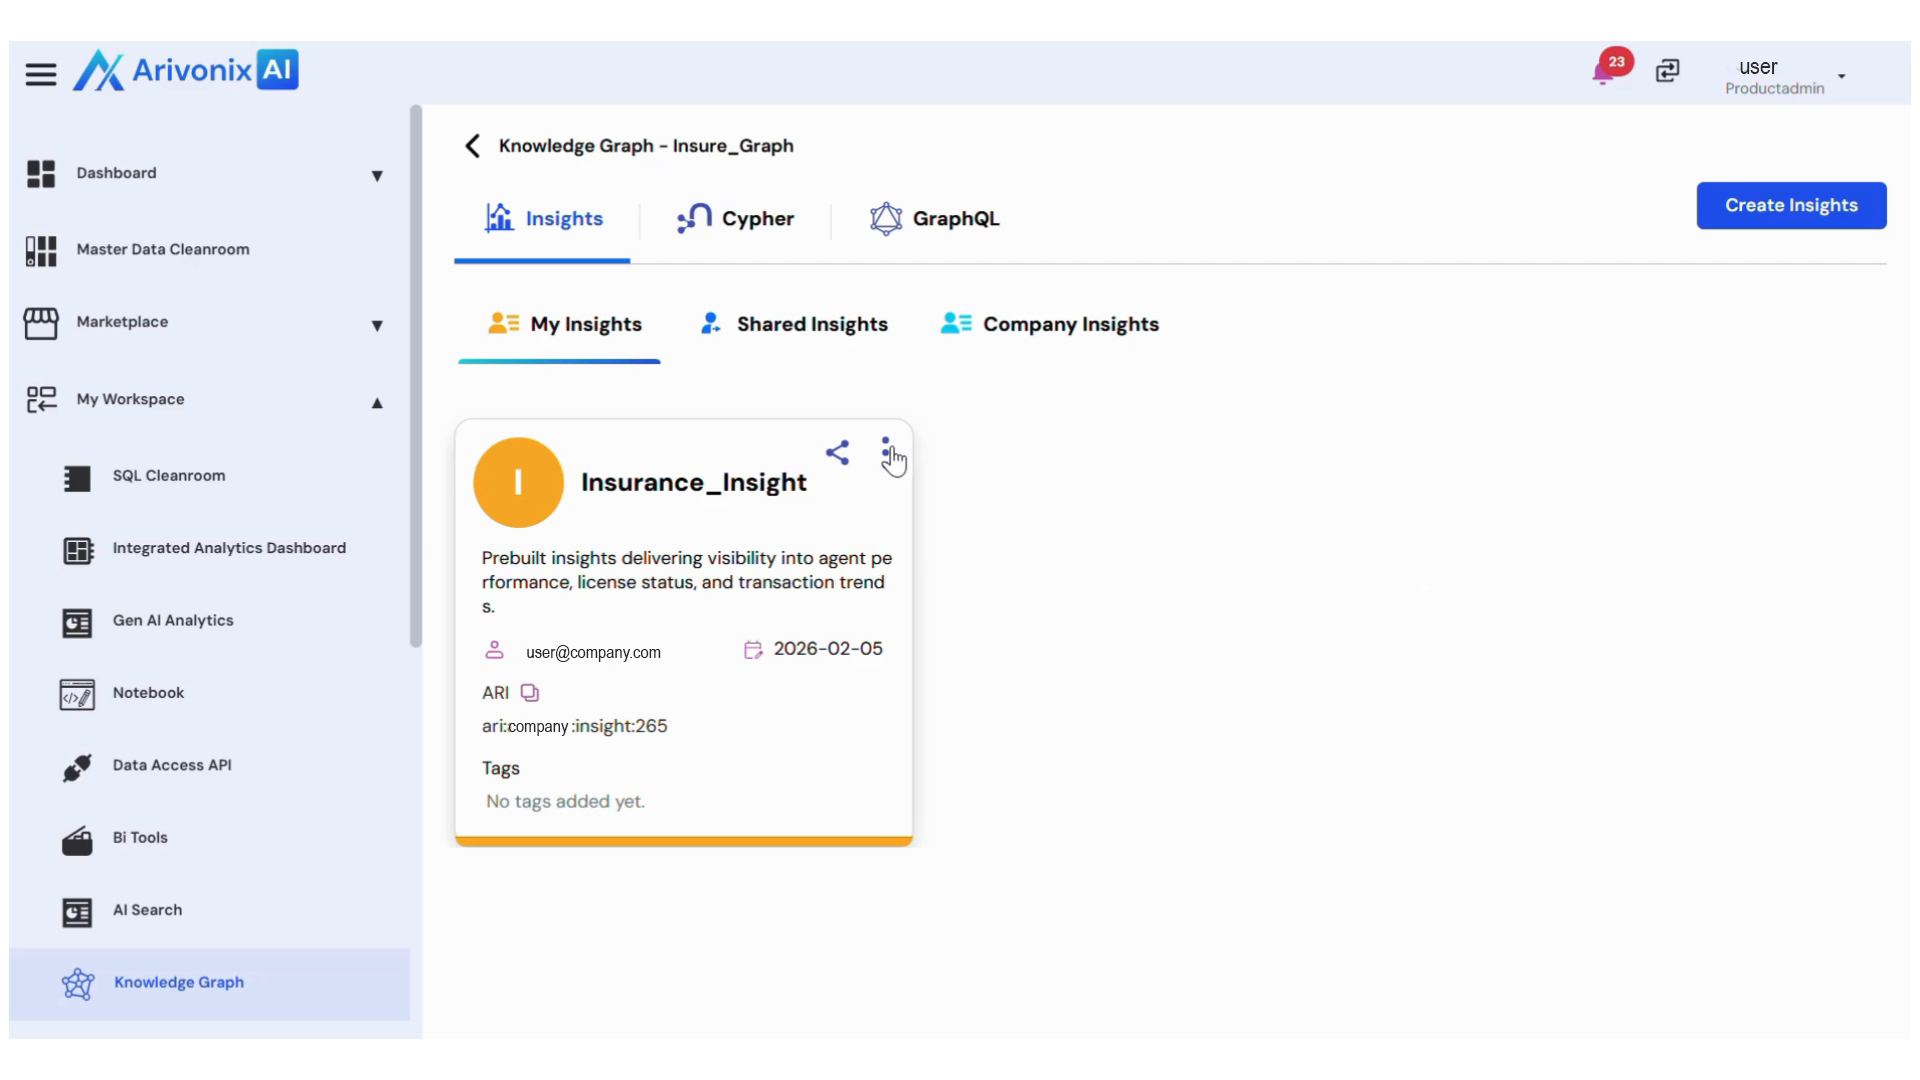
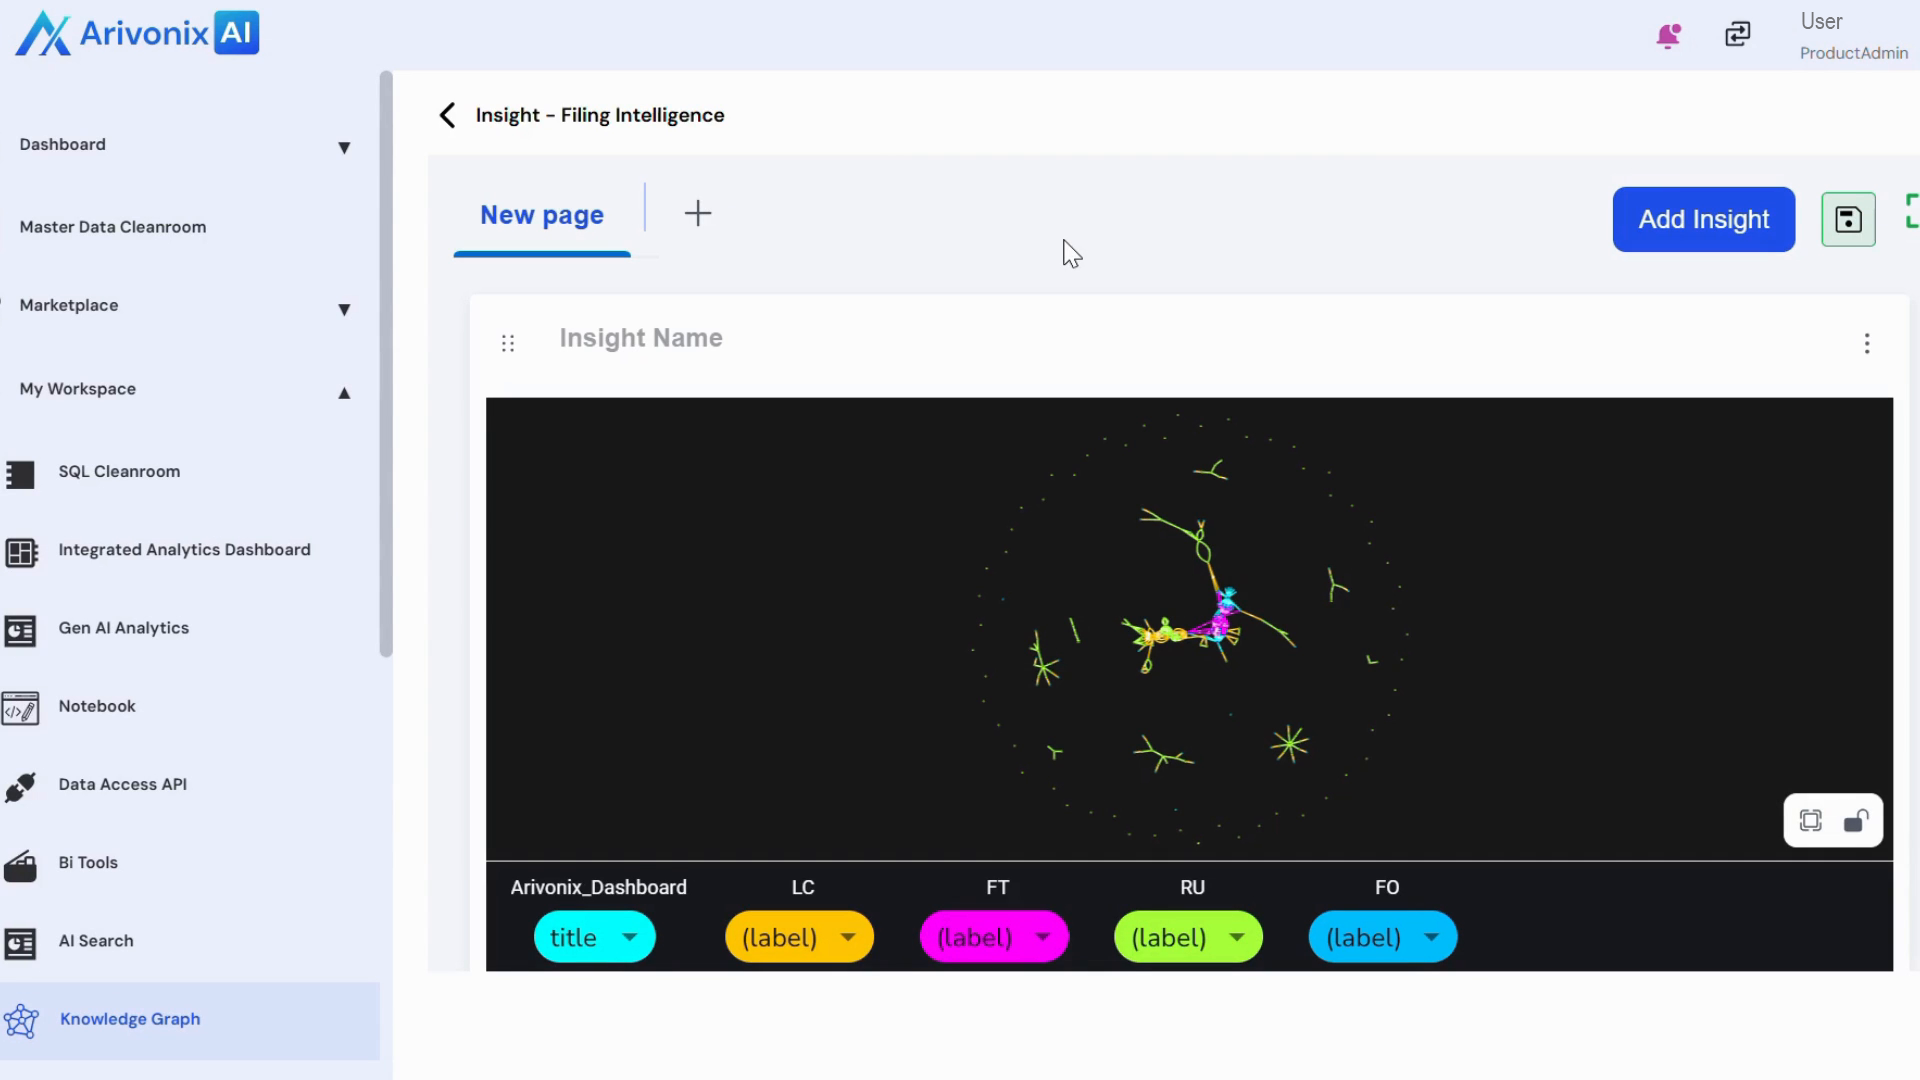
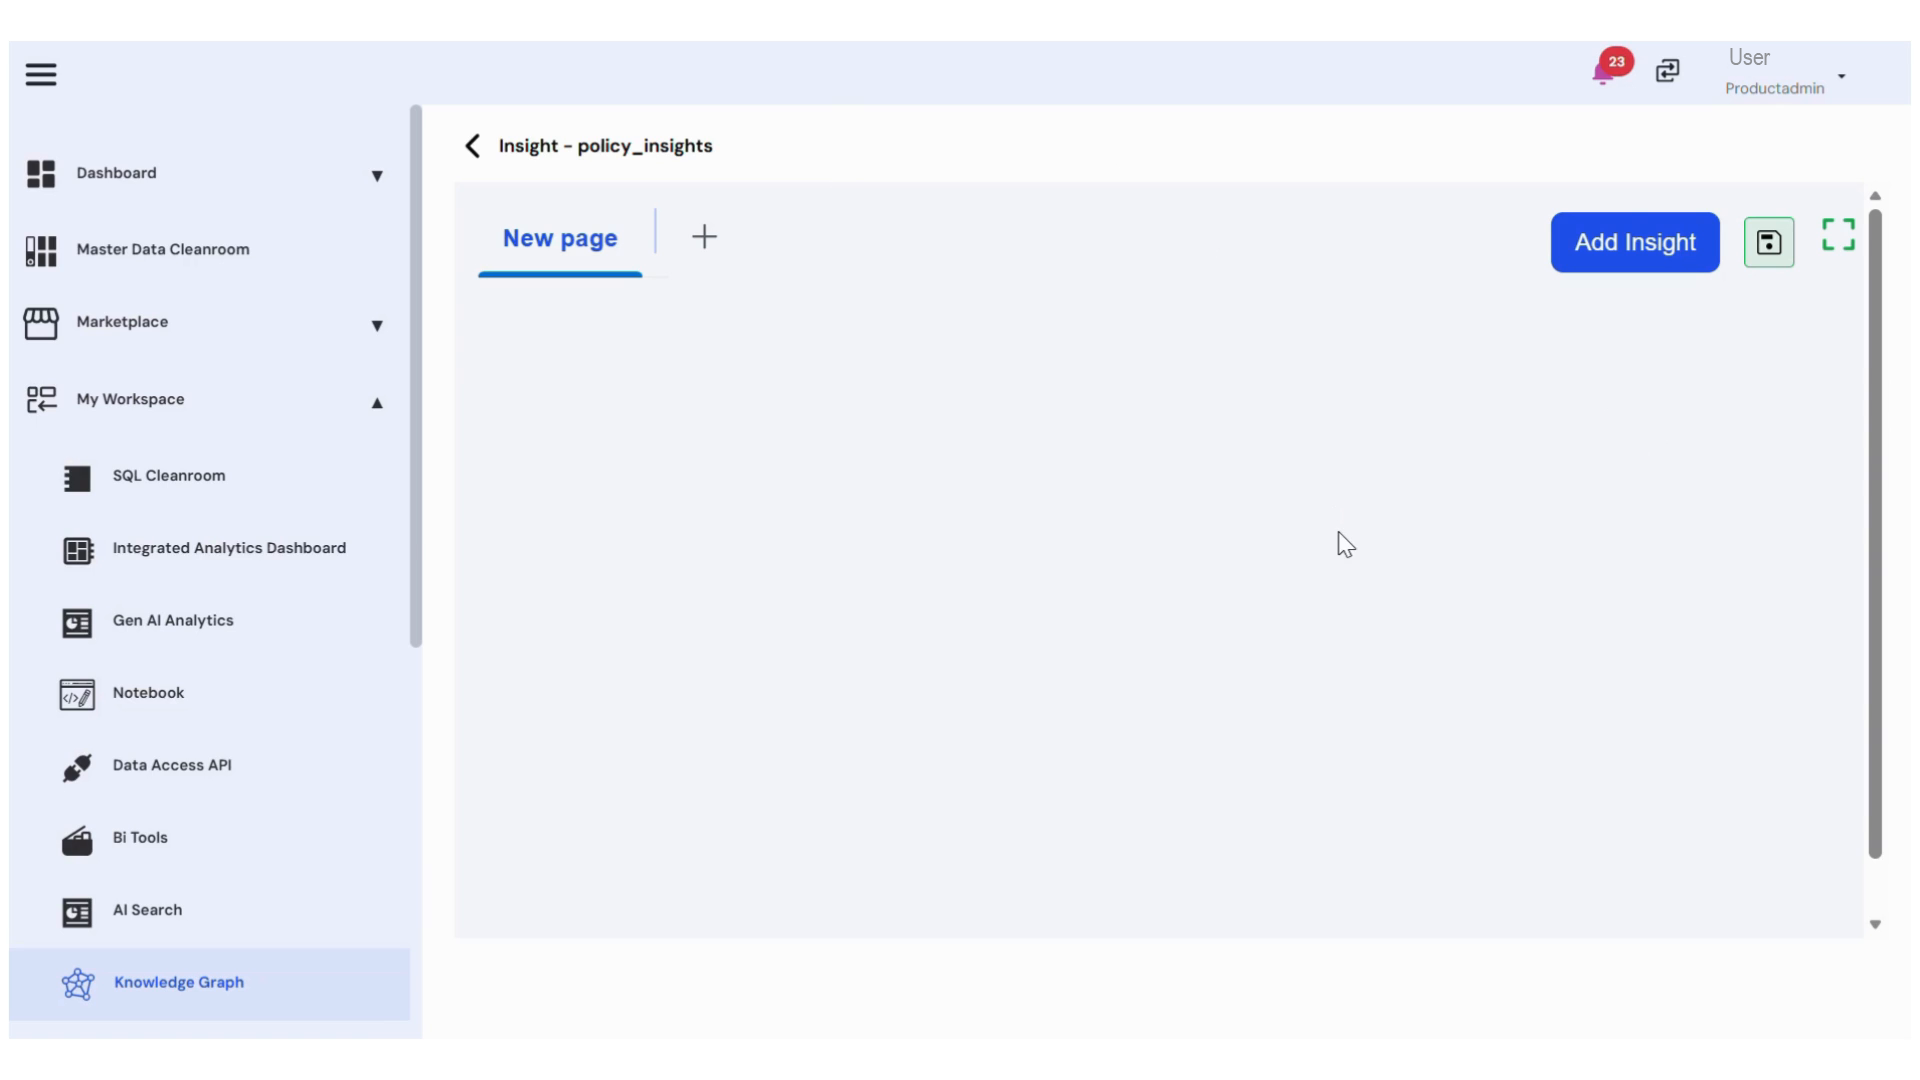
- The Insight Screen appears.
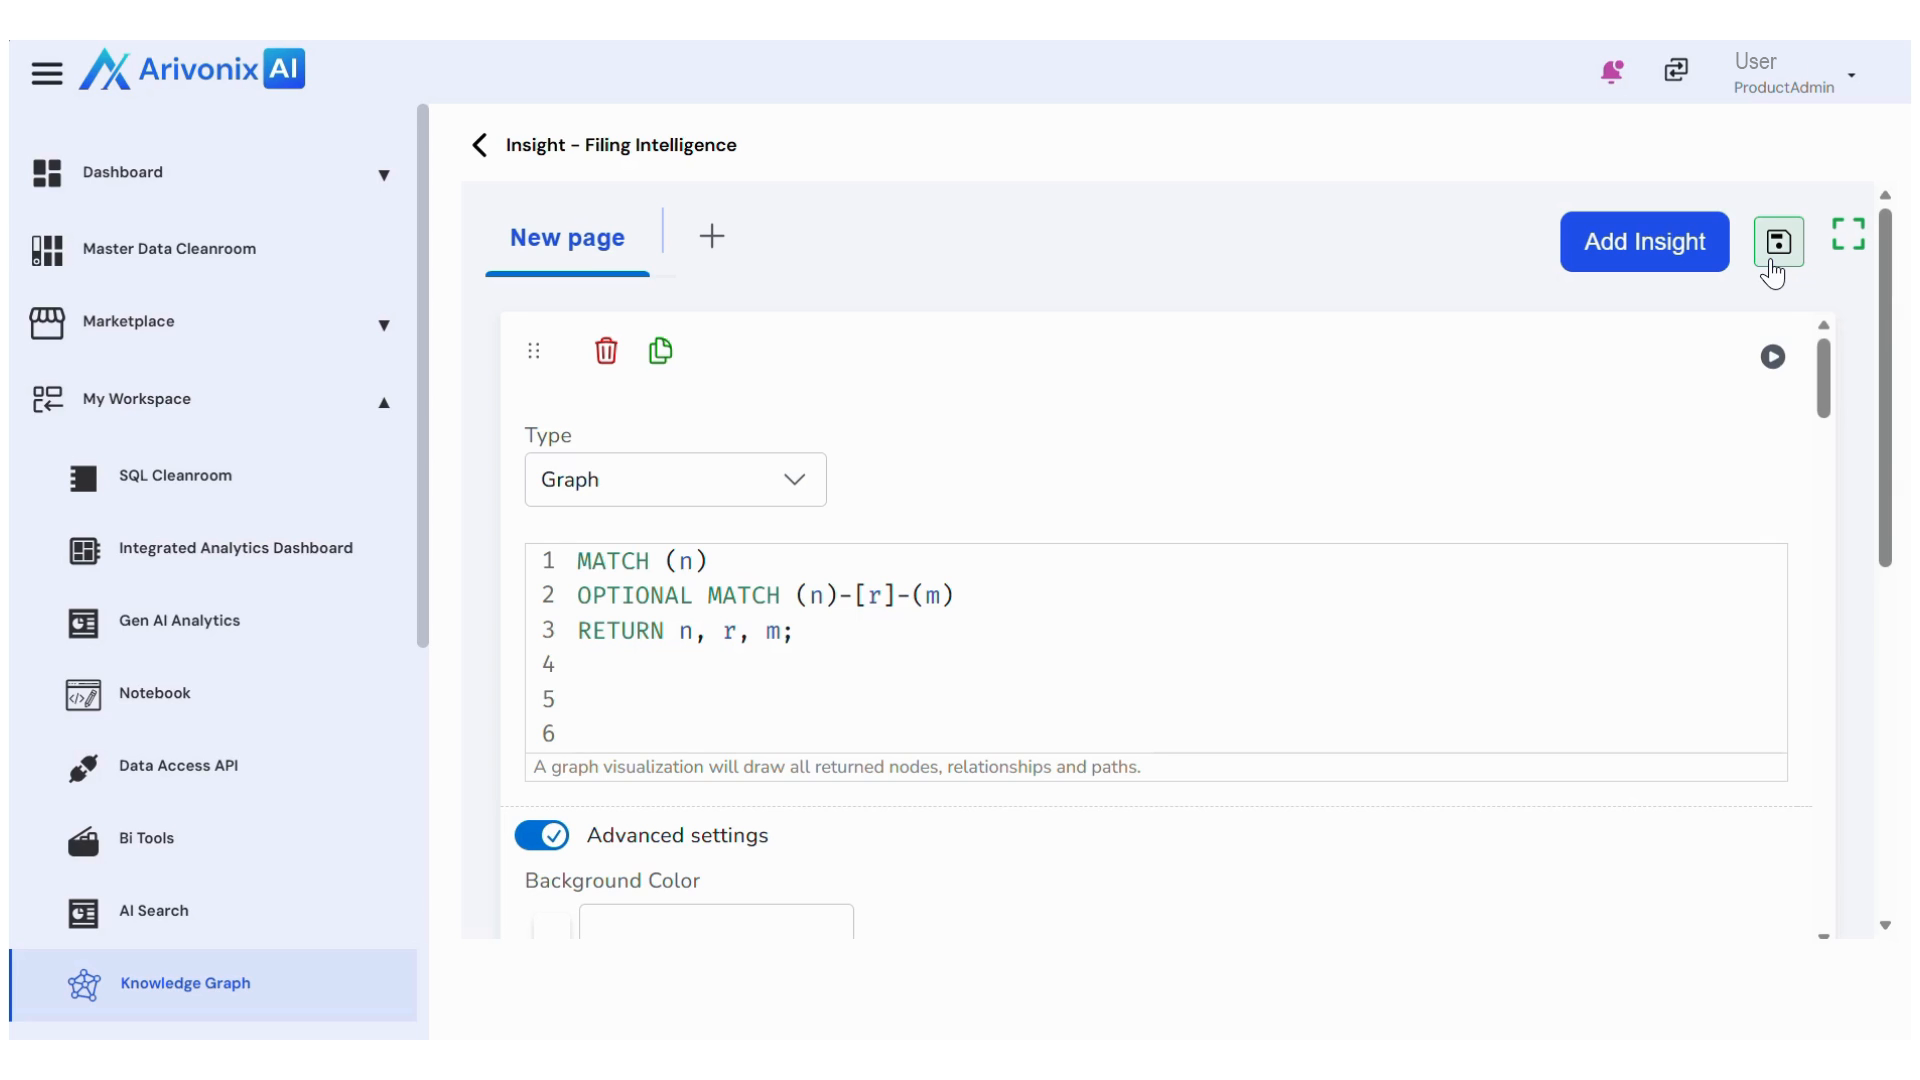
- Click Add Insight and select Settings.
- Configure the following settings:
- Select the desired graph type
- Enter the Cypher Query
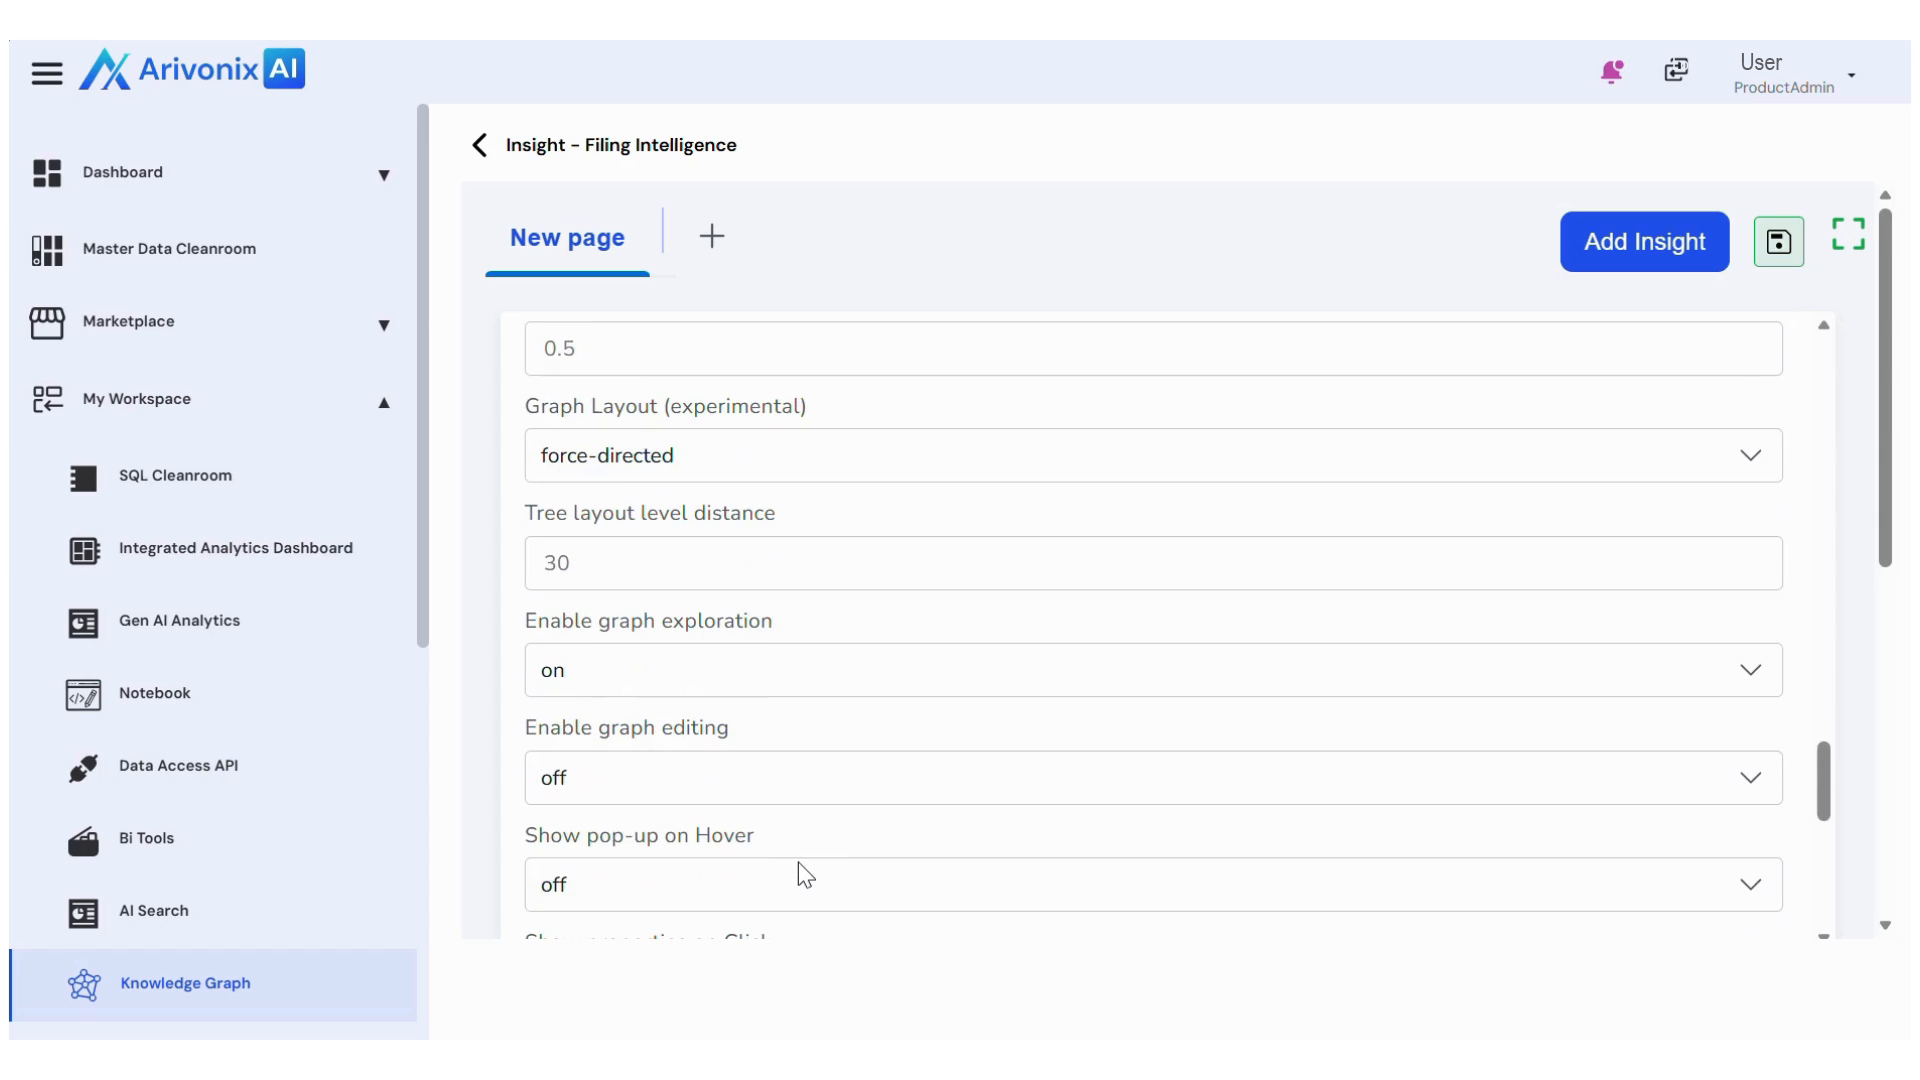
- For additional customization, enable Advanced Settings to modify:
- Background color
- Node details
- Font size
- Font titles etc.
- Click the Save icon in the top right corner to save the configuration.
- After saving, click the Run icon below the Save icon to generate the graph.
- To add additional insights, click the Plus icon at the top of the screen.