Knowledge Graph Overview
On this page
Knowledge Graph Overview
Organize and manage connected enterprise data as graphs to enable powerful insights, analytics, and AI use cases.
Accessing Knowledge Graph
Navigate to My Workspace and select Knowledge Graph from the left-hand navigation menu. 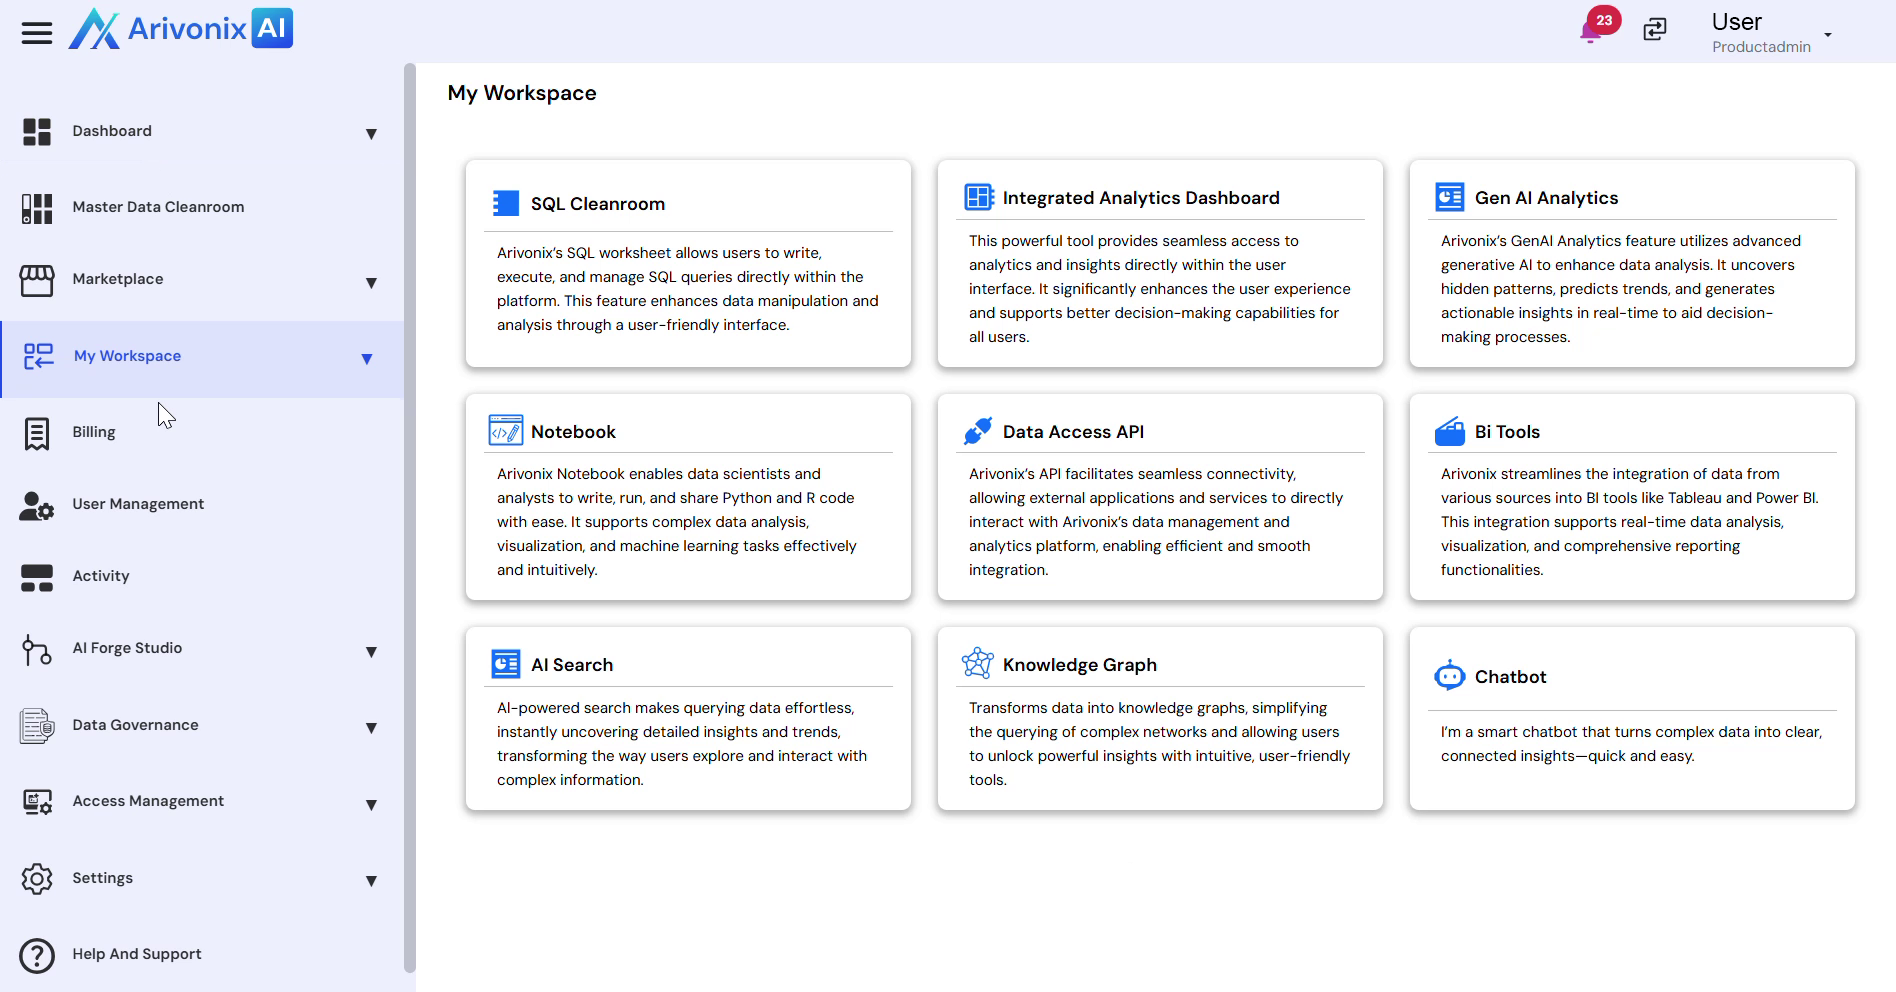
Understanding the Interface
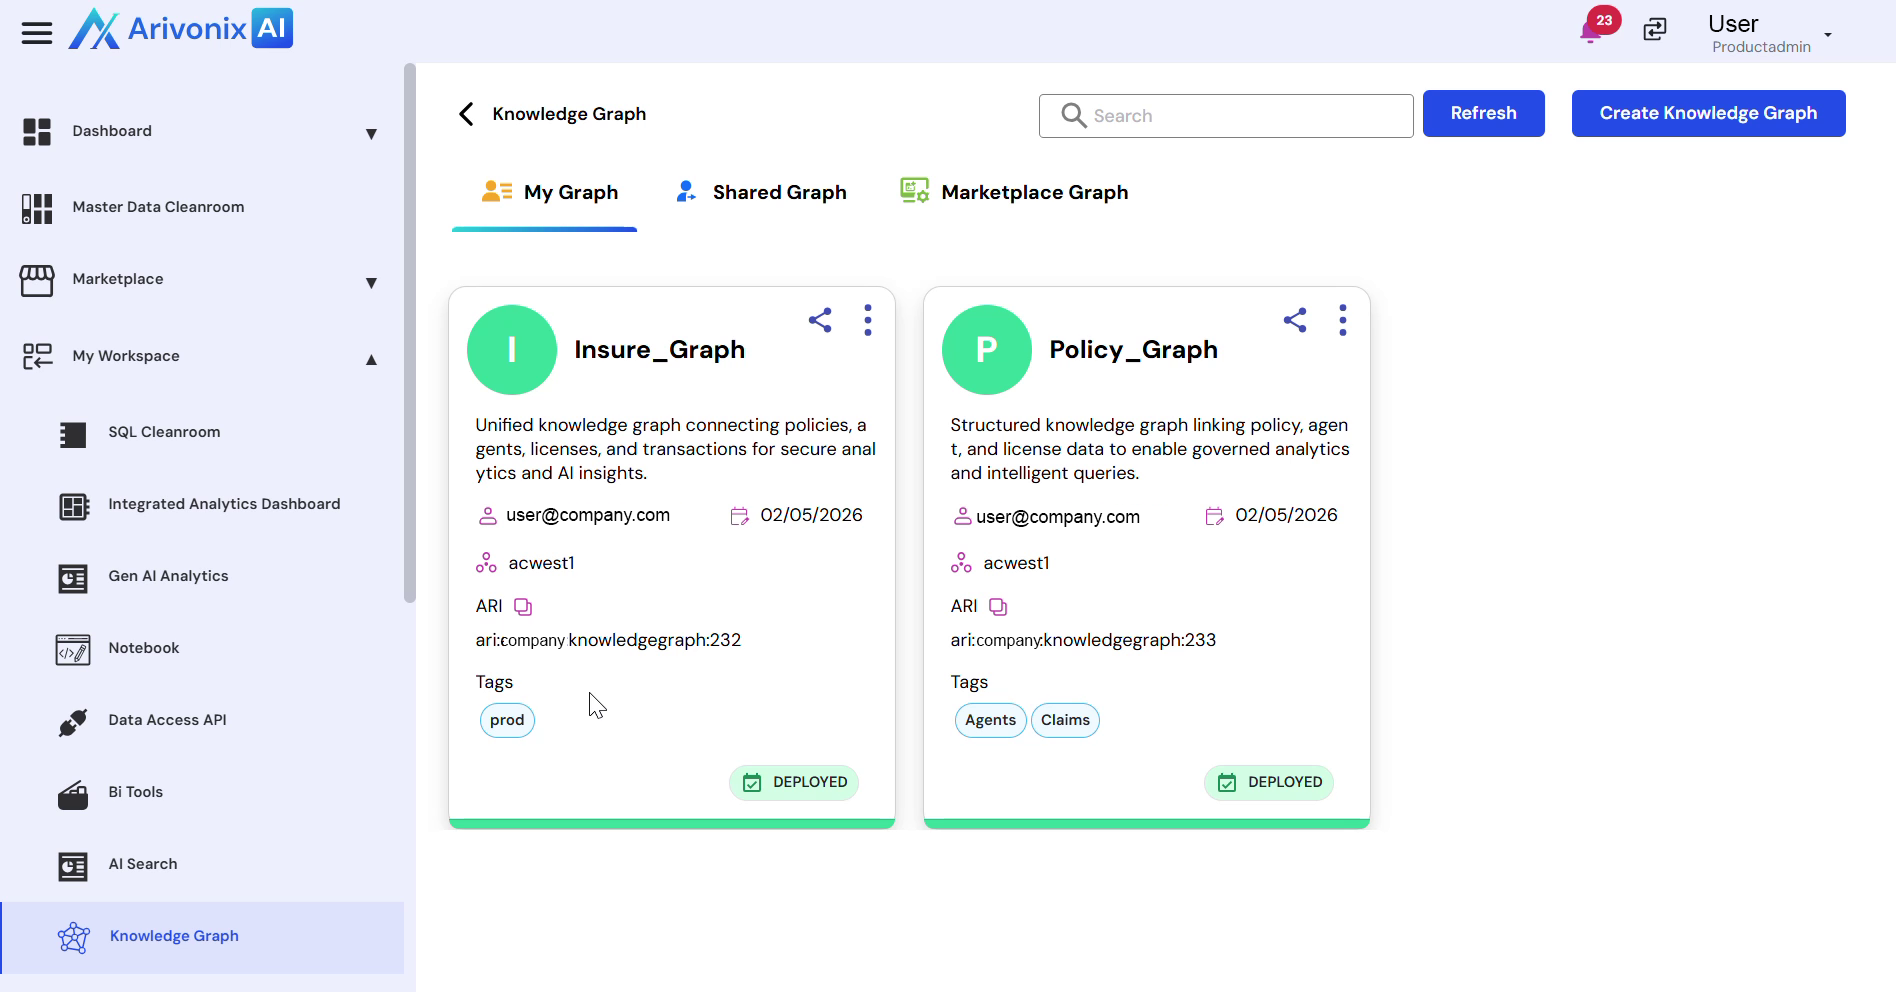
The Knowledge Graph interface is organized into three main sections:
- My Graph: Displays personally created Knowledge Graphs
- Shared Graphs: Shows graphs shared with the user
- Marketplace Graphs: Contains available marketplace graphs
Each graph card displays key information including:
- Group Name
- Description
- Owner
- Creation Date
- Region
- ARI Tags
- Deployment Status
Working with Graphs
To explore a Knowledge Graph:
- Locate the desired graph card
- Click Explore from the Action menu
- Access the graph details view with the following capabilities:
- Insights: View and analyze graph insights
- Cipher: Query the graph using Cipher
- GraphQL: Interact with the graph using GraphQL
Working with Insights
Under the Insights tab, users can access:
- My Insights: Personal graph insights
- Shared Insights: Insights shared by others
- Company Insights: Organization-wide insights
Select View on any insight to examine the underlying Knowledge Graph visualization, which helps analyze relationships, patterns, and trends across the data. Knowledge Graph serves as a foundation for advanced analytics, AI insights, and intelligent querying capabilities.