Viewing Knowledge Graph
On this page
Viewing Knowledge Graph
Visualize and explore entity relationships through an interactive knowledge graph representation that displays insights and connections.
Accessing the Knowledge Graph
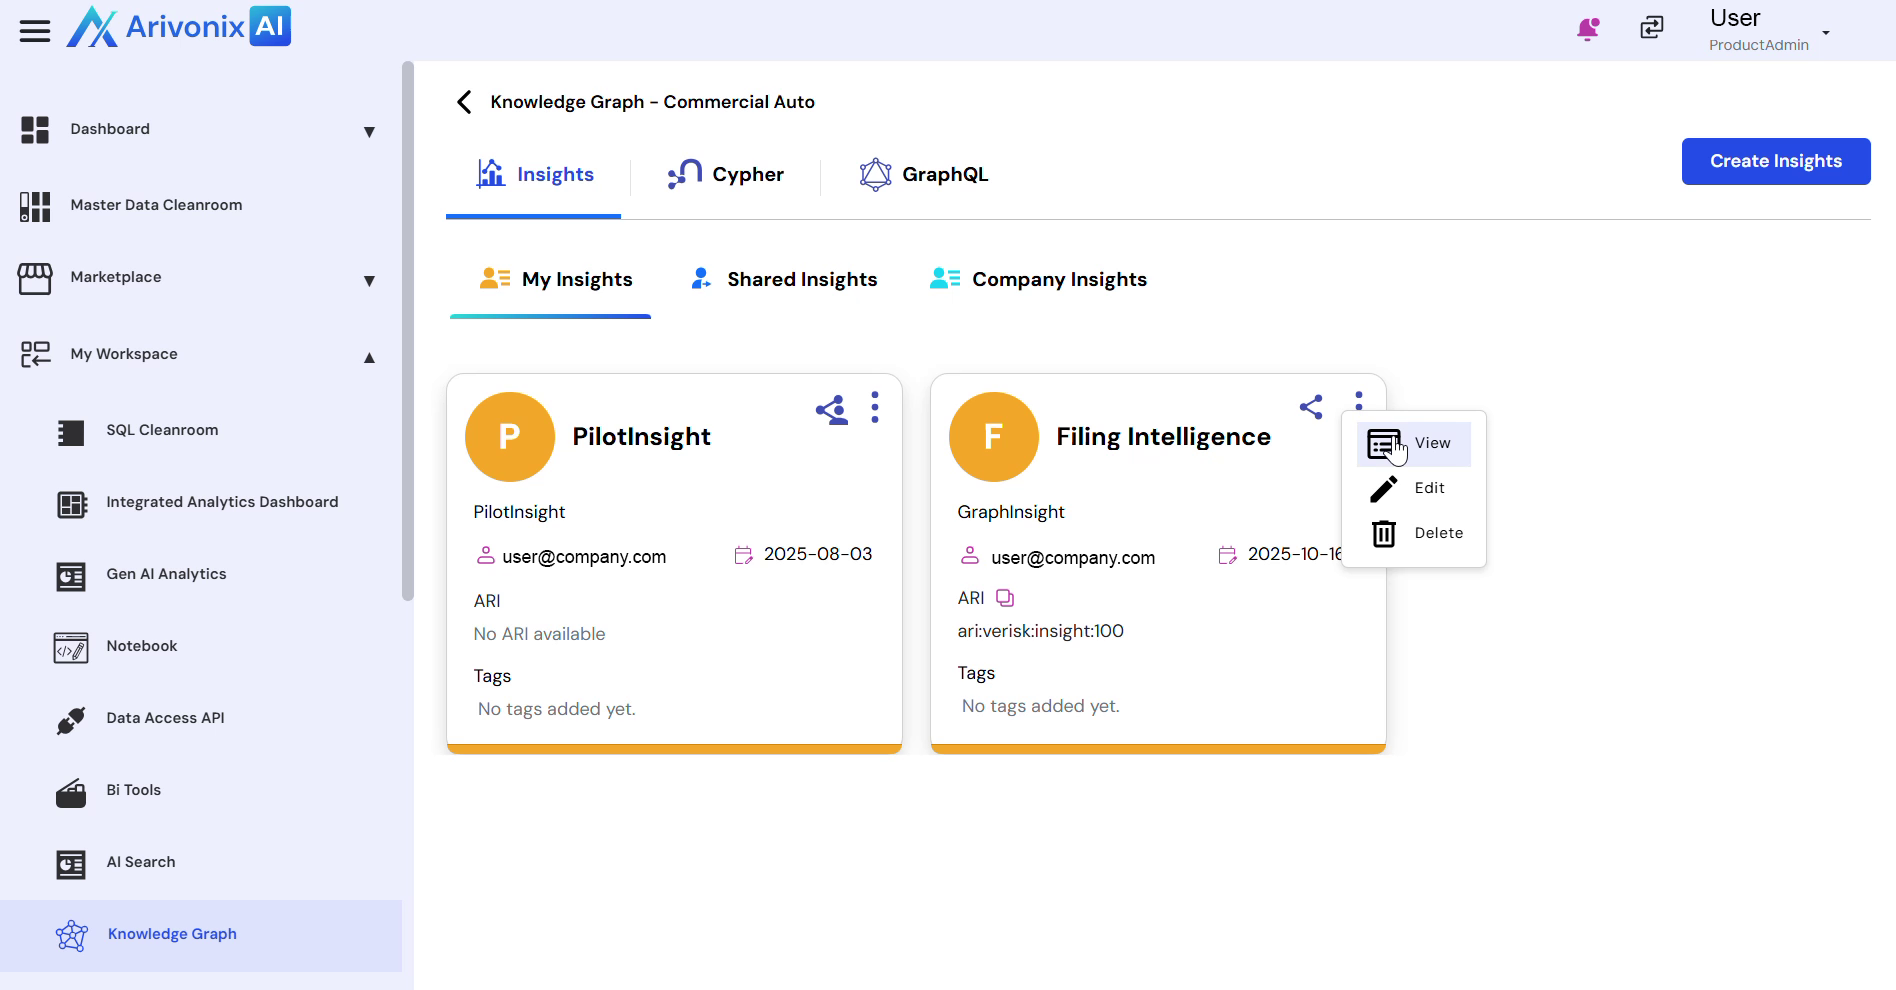
- Navigate to the Insights screen.
- Locate the Action Menu
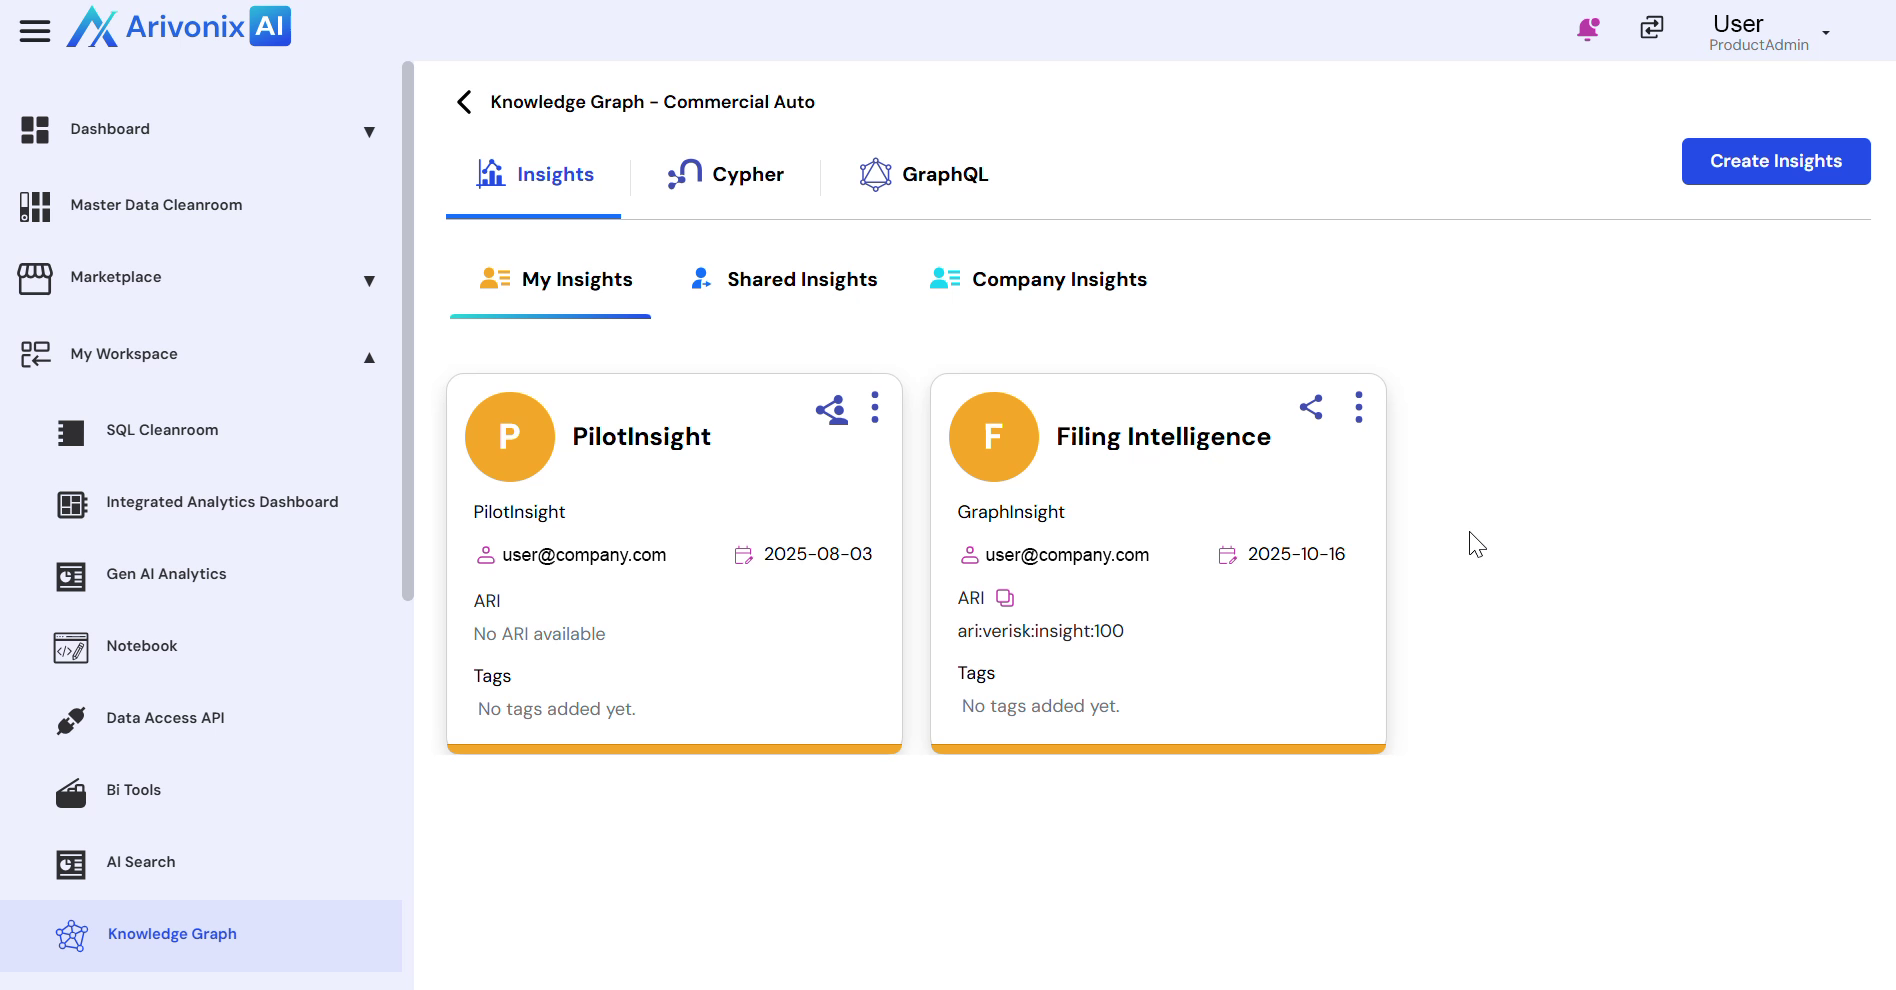
- Click View
Understanding Graph Visualization
The Knowledge Graph visualization screen displays the generated graph with the following elements:
- A primary entity node at the center, representing the core object derived from the Insight
- Related entity nodes arranged around the center
- Connecting lines between nodes showing relationships
- Relationship labels on connecting lines indicating:
- Usage
- Type
- Exclusion
- Conditions
Visual Elements
- Each entity type is distinguished by a unique color coding
- A legend at the bottom of the screen provides color and label references
- Interactive features allow users to:
- Pan across the graph
- Zoom in and out
- Explore relationships in detail
- Trace entity connections visually